Note
Click here to download the full example code
Coastlines and borders
Plotting coastlines and borders is handled by pygmt.Figure.coast.
import pygmt
Shorelines
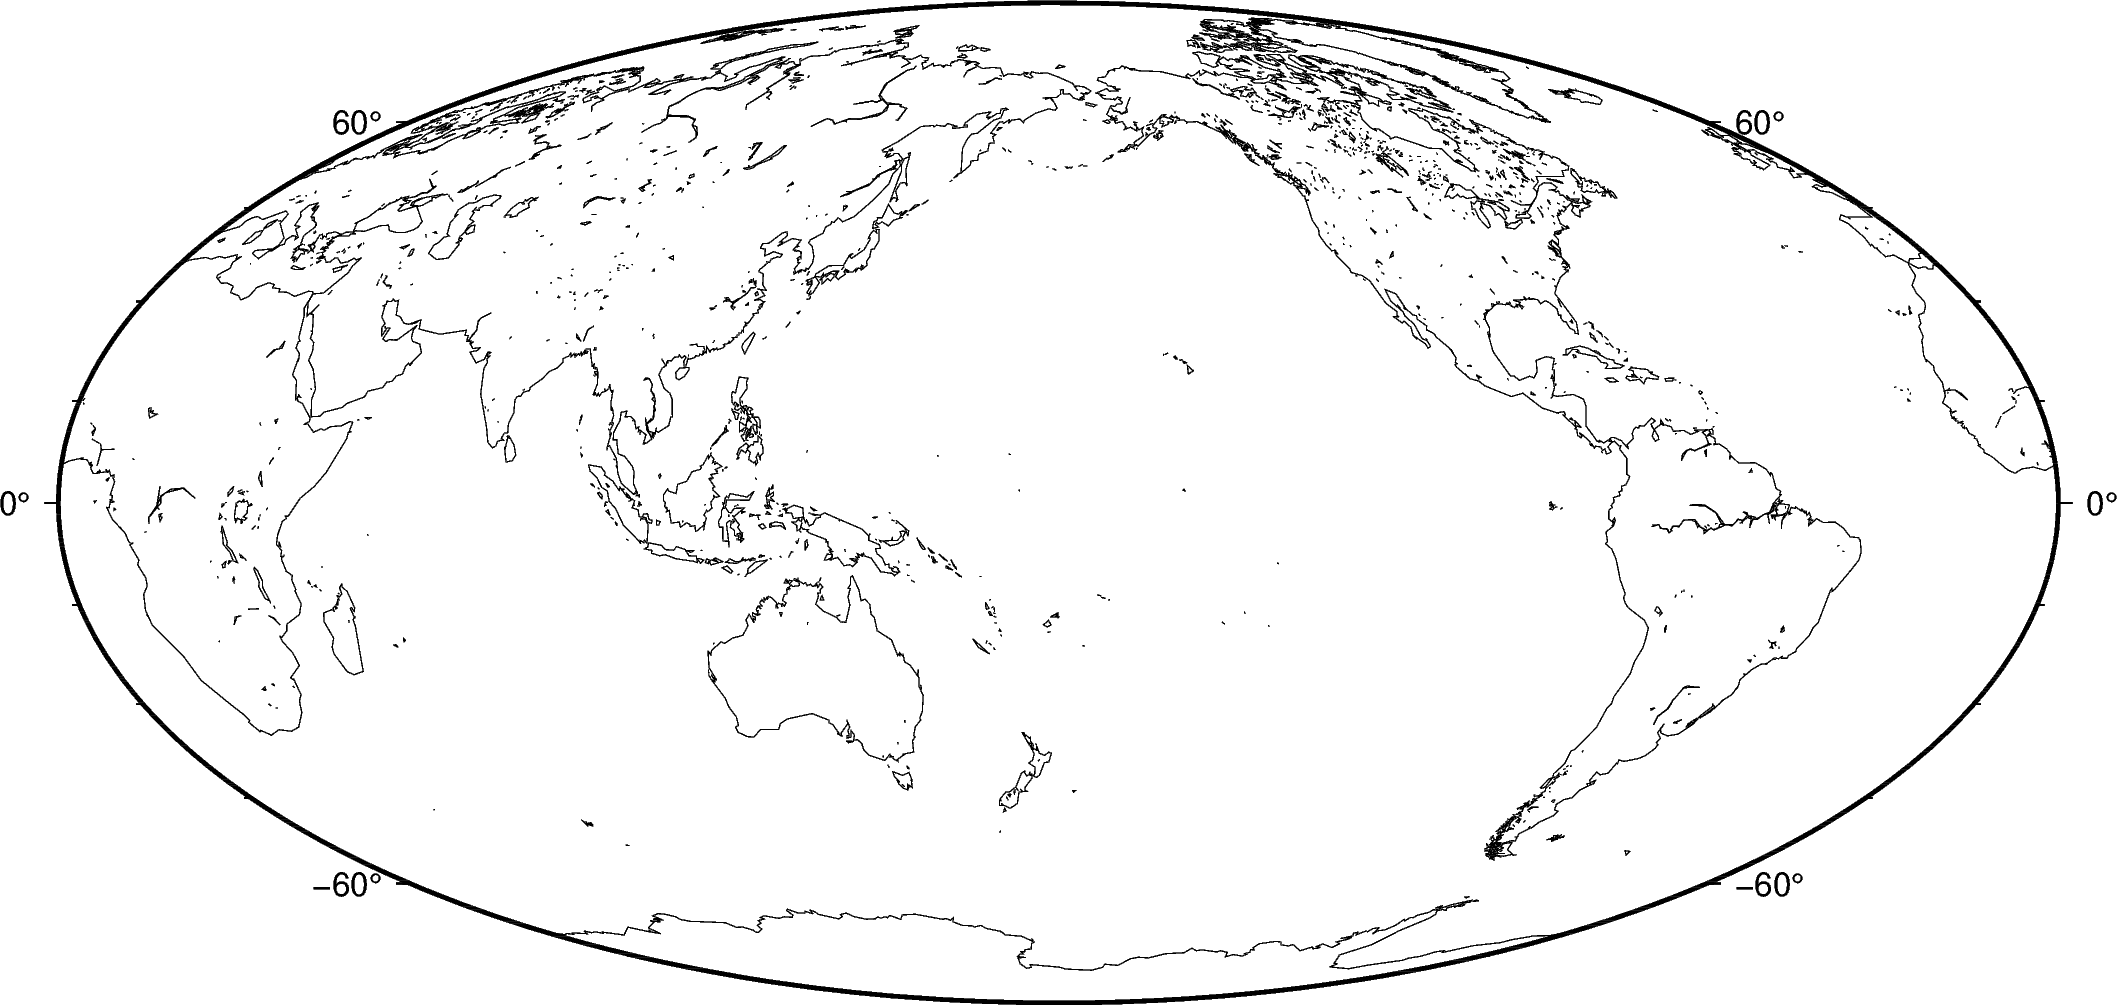
Use the shorelines argument to plot only the shorelines:
fig = pygmt.Figure()
fig.basemap(region="g", projection="W10i", frame=True)
fig.coast(shorelines=True)
fig.show()
Out:
<IPython.core.display.Image object>
The shorelines are divided in 4 levels:
coastline
lakeshore
island-in-lake shore
lake-in-island-in-lake shore
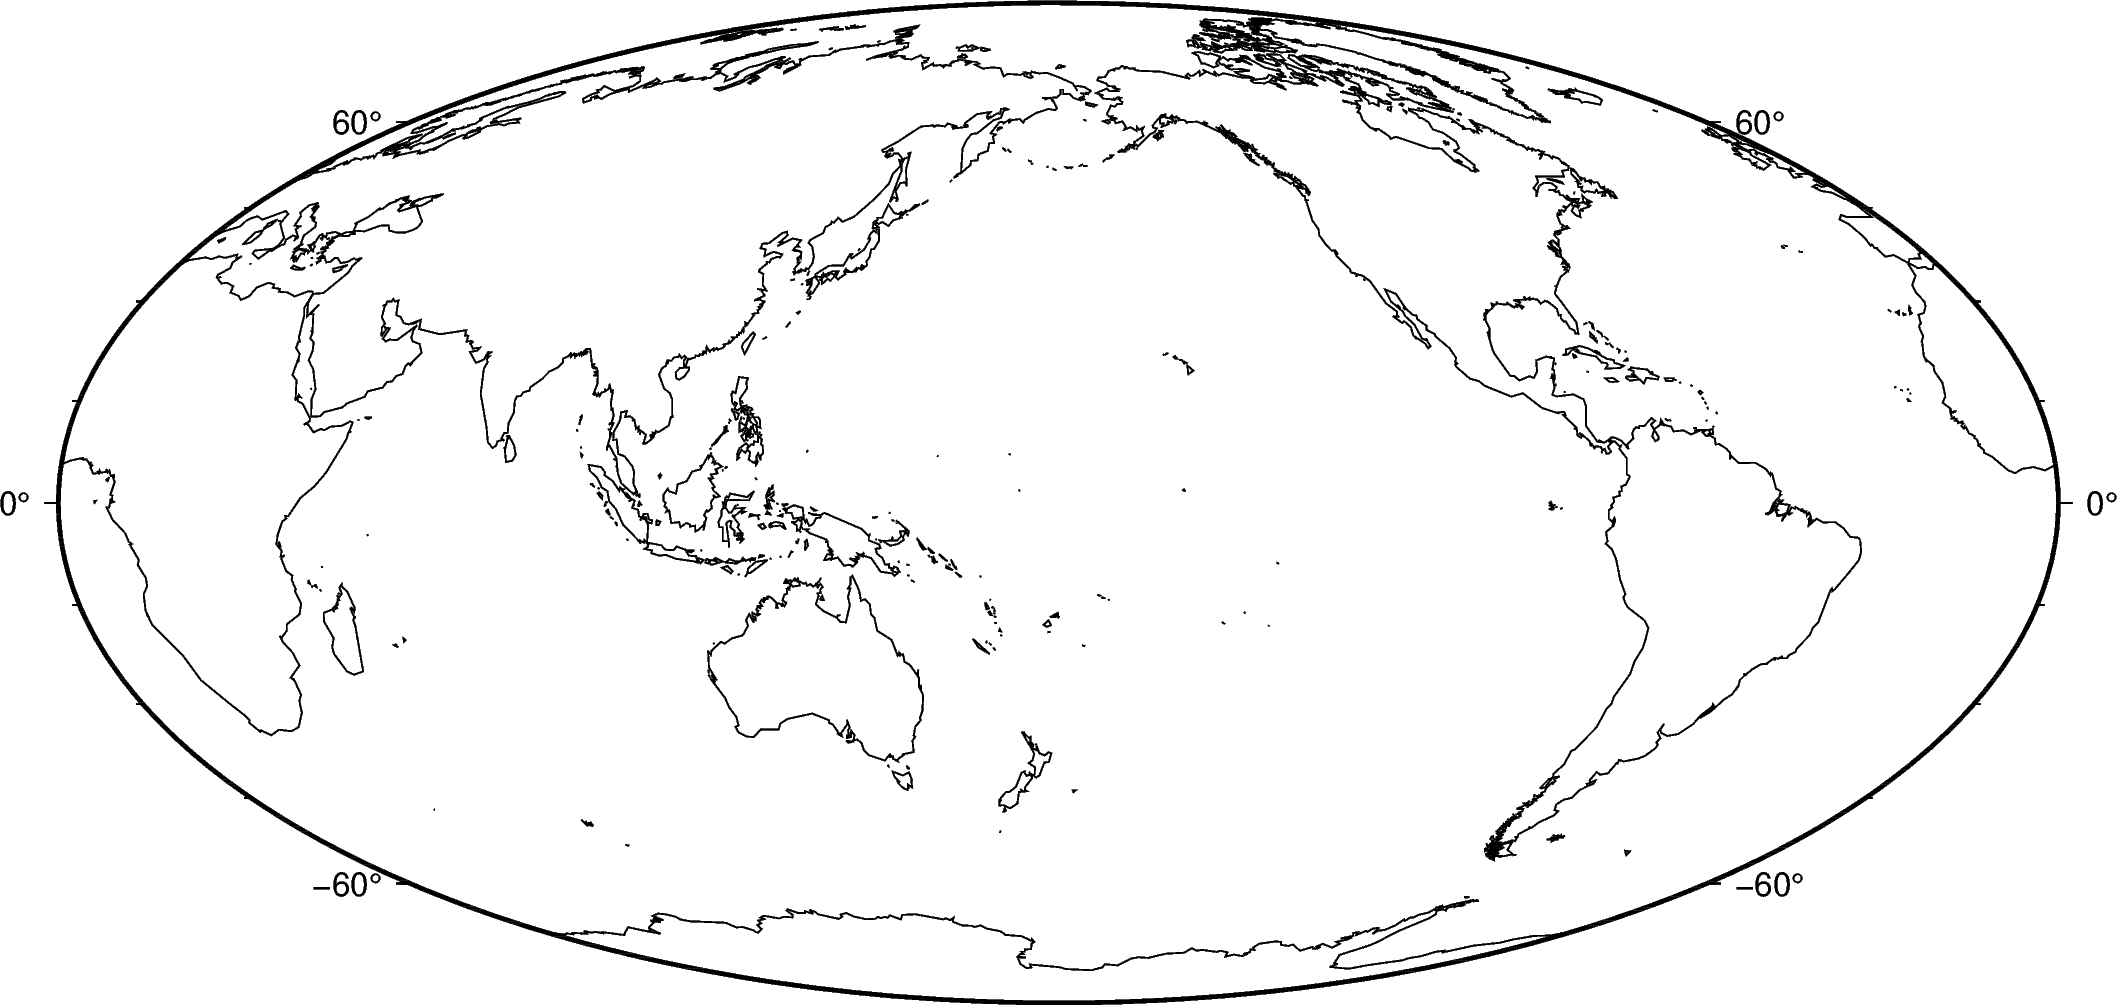
You can specify which level you want to plot by passing the level number and a GMT pen configuration. For example, to plot just the coastlines with 0.5 thickness and black lines:
fig = pygmt.Figure()
fig.basemap(region="g", projection="W10i", frame=True)
fig.coast(shorelines="1/0.5p,black")
fig.show()
Out:
<IPython.core.display.Image object>
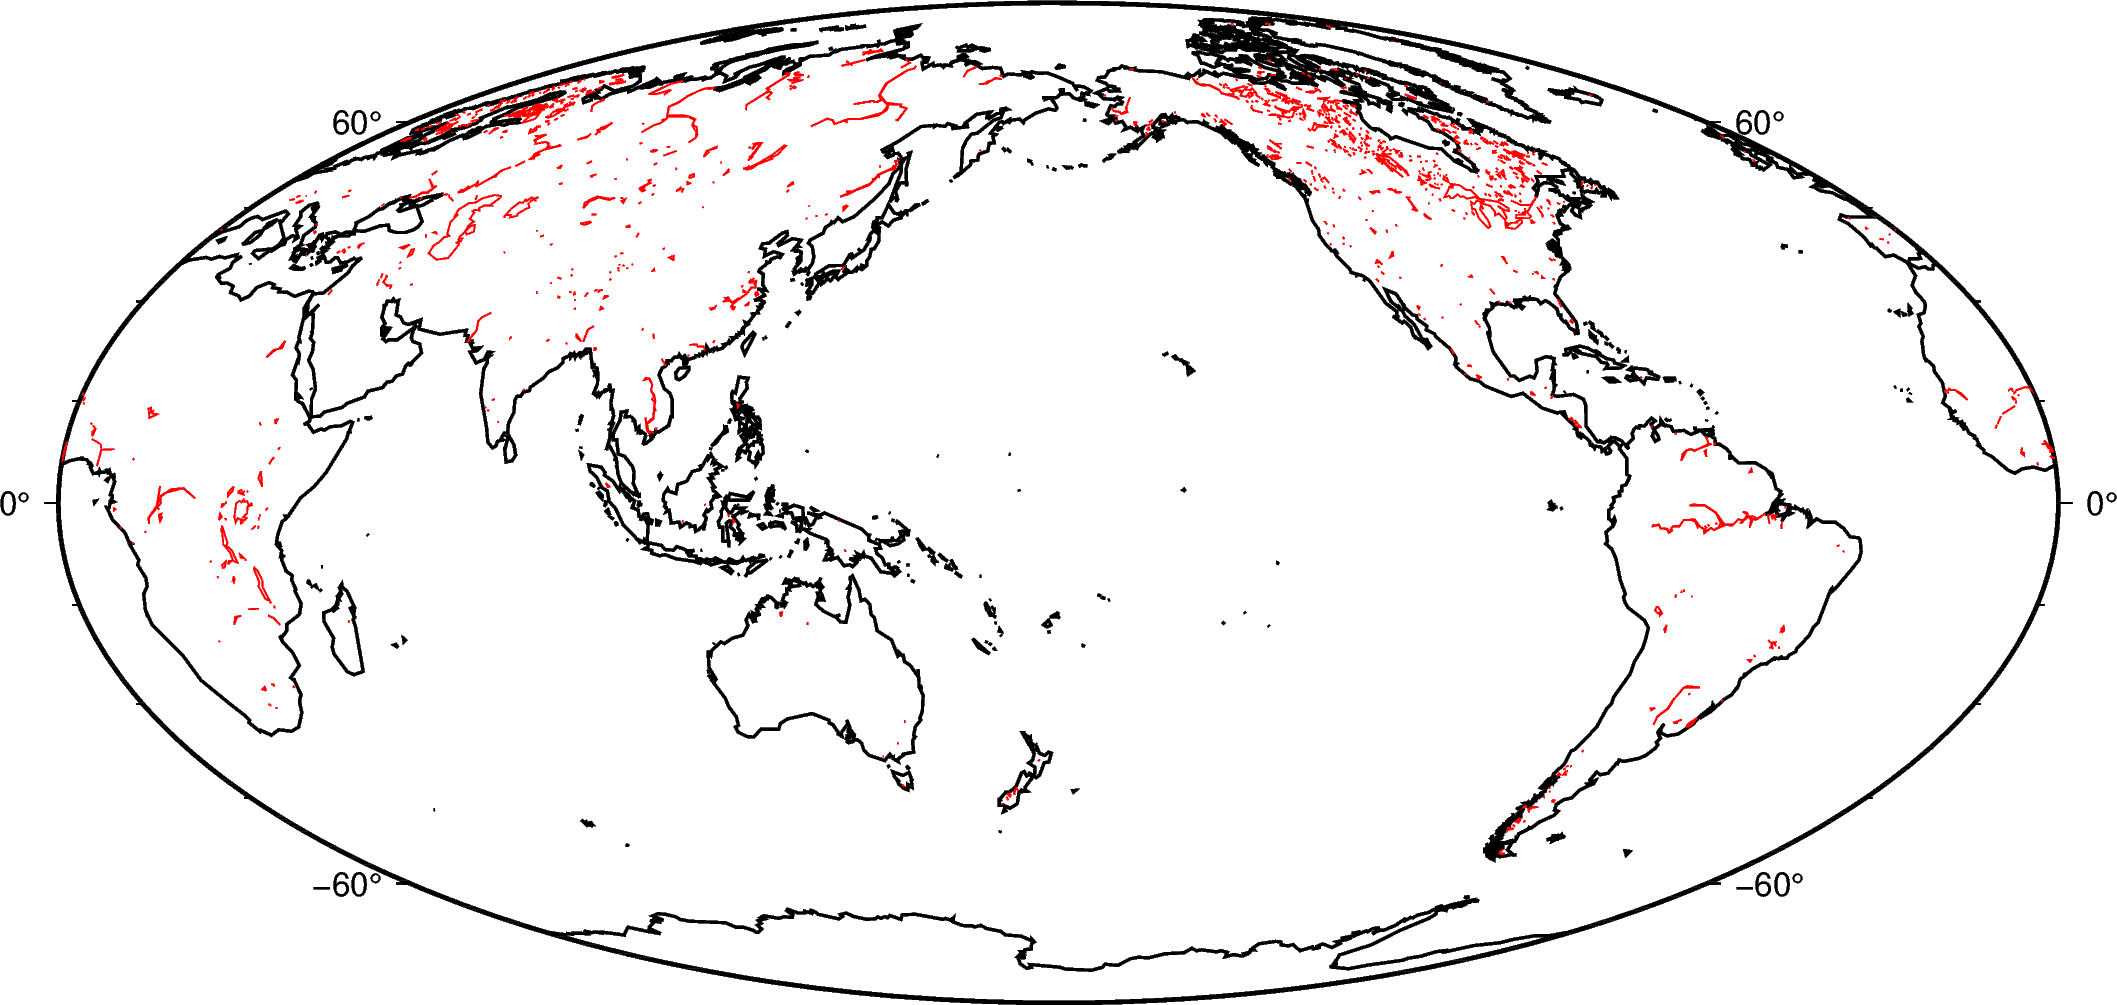
You can specify multiple levels (with their own pens) by passing a list to
shorelines:
fig = pygmt.Figure()
fig.basemap(region="g", projection="W10i", frame=True)
fig.coast(shorelines=["1/1p,black", "2/0.5p,red"])
fig.show()
Out:
<IPython.core.display.Image object>
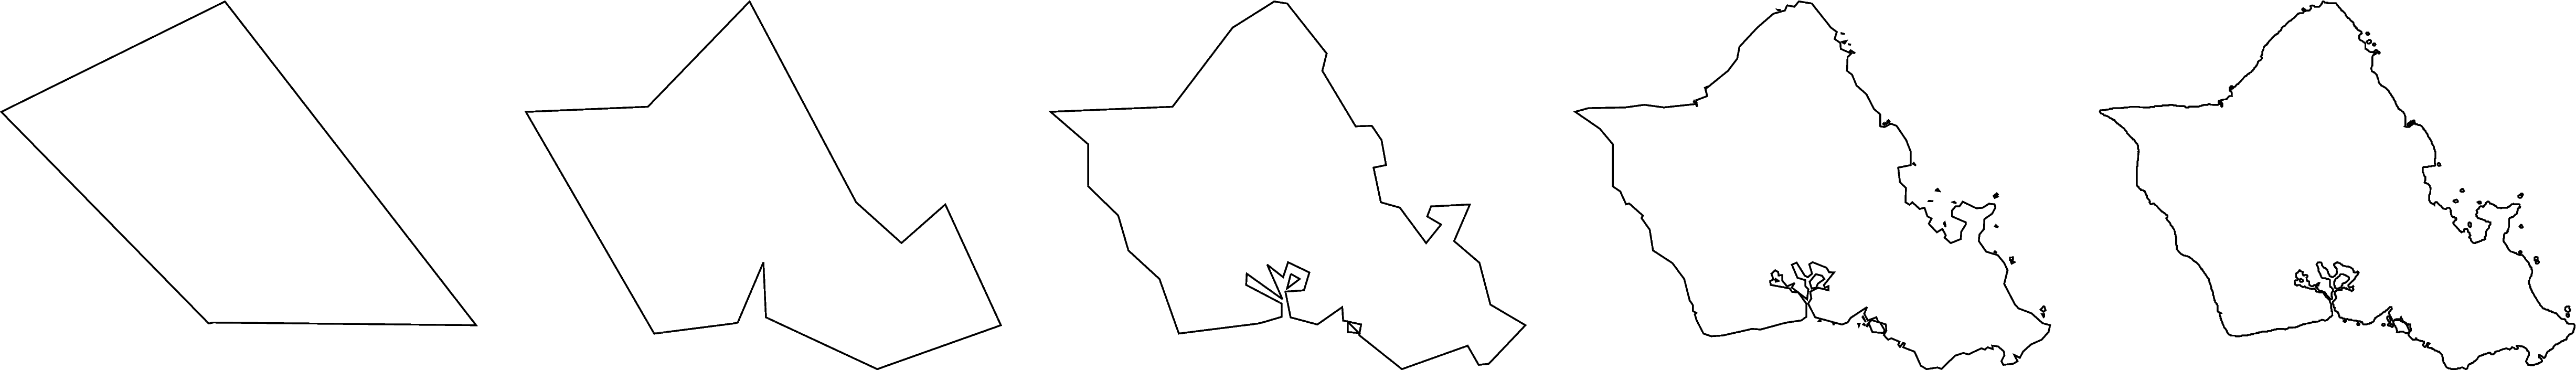
Resolutions
The coastline database comes with 5 resolutions. The resolution drops by 80% between levels:
"c": crude"l": low (default)"i": intermediate"h": high"f": full
oahu = [-158.3, -157.6, 21.2, 21.8]
fig = pygmt.Figure()
for res in ["c", "l", "i", "h", "f"]:
    fig.coast(resolution=res, shorelines="1p", region=oahu, projection="M5i")
    fig.shift_origin(xshift="5i")
fig.show()
Out:
<IPython.core.display.Image object>
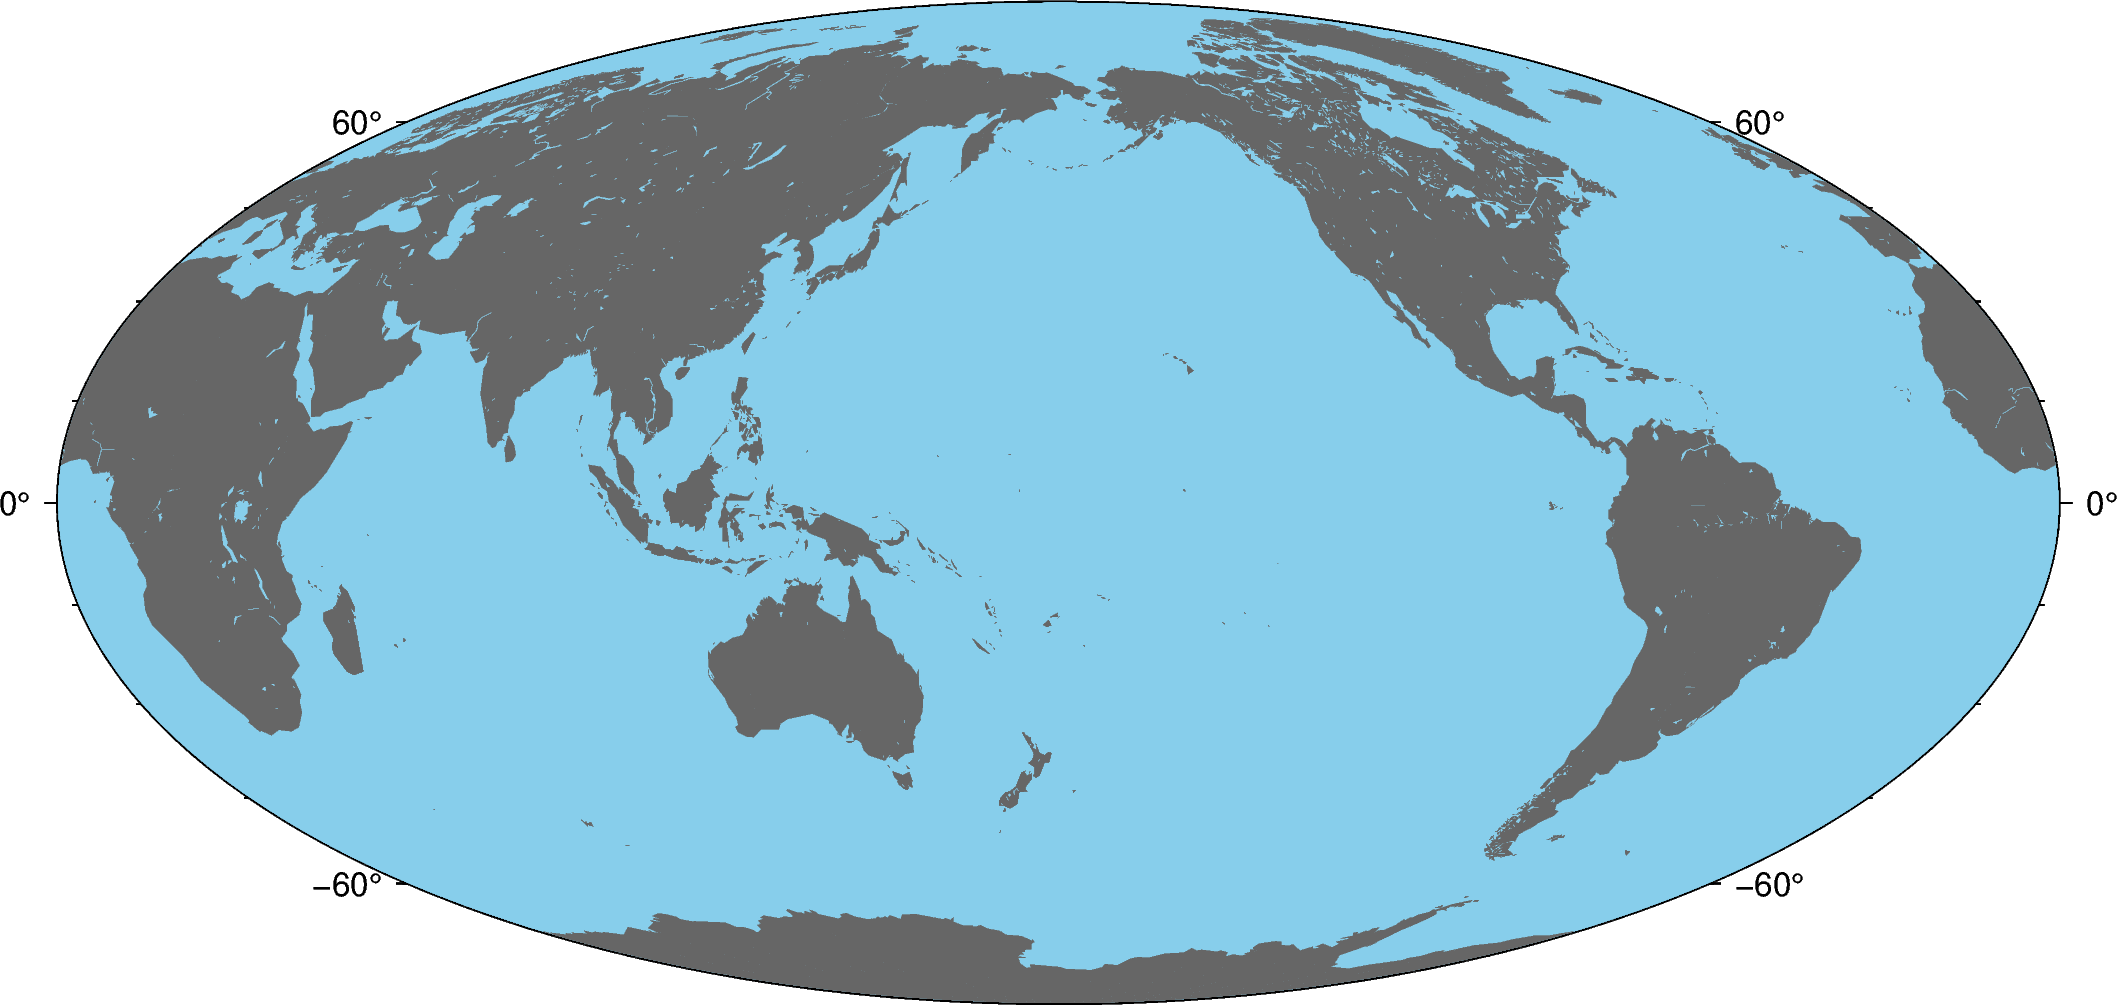
Land and water
Use the land and water attributes to specify a fill color for land and water
bodies. The colors can be given by name or hex codes (like the ones used in HTML and
CSS):
fig = pygmt.Figure()
fig.basemap(region="g", projection="W10i", frame=True)
fig.coast(land="#666666", water="skyblue")
fig.show()
Out:
<IPython.core.display.Image object>
Total running time of the script: ( 0 minutes 5.398 seconds)